
While new ship deliveries affect future ship supply, the tanker orderbook represents managers’ assessment of the industry’s future fundamental outlook. It measures the number or capacity of ships that have been ordered, as well as the number of ships under construction. A rising orderbook often suggests that future supply and demand dynamics are favorable for new or existing ships to generate good returns. Conversely, a falling orderbook paints a negative picture.
Divergence among different vessels
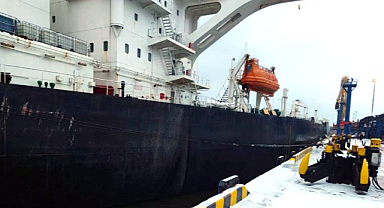
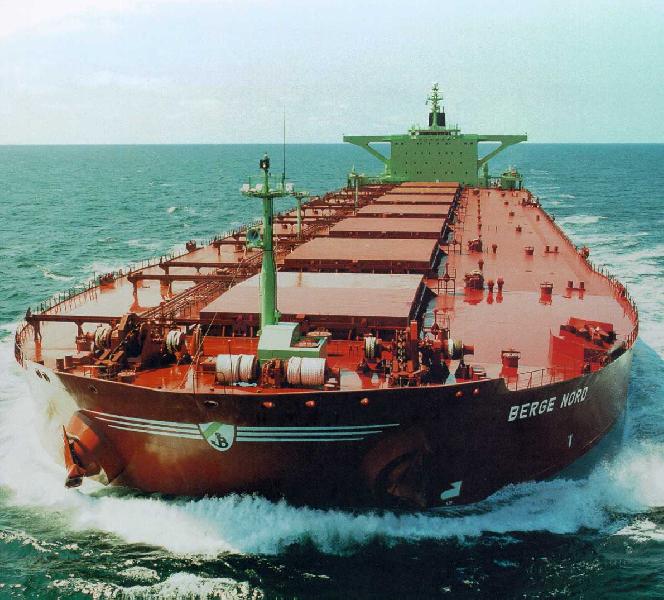
Crude tankers are used to haul crude oil (unrefined oil), particularly from the Middle East to countries in Europe, America, and Asia. Construction time can be up to five years, depending on vessel class and size, as well as how busy shipbuilders are. The overall crude tanker orderbook remains in a downtrend. Beneath the aggregate figure, though, we’re seeing some divergences. The orderbook for VLCCs (very large crude carriers) appears to have bottomed at 5.16% on August 2, while the orderbook for Suezmax continued to drop. On October 18, the orderbook for all crude tankers stood at 9.35%, VLCCs at 6.41%, and Suezmax at 8.71%.The boom and bust of the orderbook
The indicator for crude tankers has remained in a downtrend since early 2011, as managers saw the dark storm ahead. Orderbook figures hit as high as 47% mid-2008, when managers’ optimism about future oil trade growth was at its peak, largely driven by soaring oil prices and global economic growth throughout the early 2000s.
Unfortunately, that excitement evaporated with the eventual burst of the housing bubble (not just in the United States) and the beginning of an energy boom in the United States. As the global economy remained weak and cars became more fuel-efficient post–financial crisis, with alternative energy sources popping up here and there, oil consumption fell overall.
Why the divergence?
The divergence between Suezmax’s and VLCC’s orderbooks likely reflects the fact that shipments from West Africa to the United States are falling. In the future, more oil will reroute to China, which takes longer to haul. As VLCCs are larger than Suezmax vessels, it’s more economical to ship crude oil on VLCCs rather than Suezmax vessels from West Africa. So managers are expecting rates for VLCCs to rise as demand for the vessel increases more than Suezmax.
Percent of existing capacity
Analysts often use a percentage to reflect the changes in the number of operating ships over time. An orderbook based on the number of ships has little meaning without context: if 12 ships were on the orderbook, the interpretation could differ when existing capacity consisted of 30 versus 1,000 ships.
Impact on earnings and shares
While we’ve been negative about crude tanker stocks since their orderbook has remained in a downtrend over the past few years, the worst is likely over. If the orderbook does stop falling and begins to turn around, as is currently happening with other shipping companies, crude shipping stocks like Frontline Ltd. (FRO), DryShips Inc. (DRYS), Teekay Tankers Ltd. (TNK), and Nordic American Tanker Ltd. (NAT) should benefit. Of course, that is if they don’t run out of cash before then. The Guggenheim Shipping ETF (SEA) will also benefit from an orderbook that has stopped falling.
Divergence among different vessels
Crude tankers are used to haul crude oil (unrefined oil), particularly from the Middle East to countries in Europe, America, and Asia. Construction time can be up to five years, depending on vessel class and size, as well as how busy shipbuilders are. The overall crude tanker orderbook remains in a downtrend. Beneath the aggregate figure, though, we’re seeing some divergences. The orderbook for VLCCs (very large crude carriers) appears to have bottomed at 5.16% on August 2, while the orderbook for Suezmax continued to drop. On October 18, the orderbook for all crude tankers stood at 9.35%, VLCCs at 6.41%, and Suezmax at 8.71%.The boom and bust of the orderbook
The indicator for crude tankers has remained in a downtrend since early 2011, as managers saw the dark storm ahead. Orderbook figures hit as high as 47% mid-2008, when managers’ optimism about future oil trade growth was at its peak, largely driven by soaring oil prices and global economic growth throughout the early 2000s.
Unfortunately, that excitement evaporated with the eventual burst of the housing bubble (not just in the United States) and the beginning of an energy boom in the United States. As the global economy remained weak and cars became more fuel-efficient post–financial crisis, with alternative energy sources popping up here and there, oil consumption fell overall.
Why the divergence?
The divergence between Suezmax’s and VLCC’s orderbooks likely reflects the fact that shipments from West Africa to the United States are falling. In the future, more oil will reroute to China, which takes longer to haul. As VLCCs are larger than Suezmax vessels, it’s more economical to ship crude oil on VLCCs rather than Suezmax vessels from West Africa. So managers are expecting rates for VLCCs to rise as demand for the vessel increases more than Suezmax.
Percent of existing capacity
Analysts often use a percentage to reflect the changes in the number of operating ships over time. An orderbook based on the number of ships has little meaning without context: if 12 ships were on the orderbook, the interpretation could differ when existing capacity consisted of 30 versus 1,000 ships.
Impact on earnings and shares
While we’ve been negative about crude tanker stocks since their orderbook has remained in a downtrend over the past few years, the worst is likely over. If the orderbook does stop falling and begins to turn around, as is currently happening with other shipping companies, crude shipping stocks like Frontline Ltd. (FRO), DryShips Inc. (DRYS), Teekay Tankers Ltd. (TNK), and Nordic American Tanker Ltd. (NAT) should benefit. Of course, that is if they don’t run out of cash before then. The Guggenheim Shipping ETF (SEA) will also benefit from an orderbook that has stopped falling.