Following five weak months of demand growth (January-May), transported
container volumes are finally growing on the Far East to Europe trading
lane – as much as 1.9% y-o-y in the first seven months of 2013,
according to CTS. The positive development reflects a more stable
situation in the still recession-hit Southern European countries. They
are no longer an increasing drag on the positive growing Northern
European imports. Backhaul volumes increased during the same period by a brisk 5.1% y-o-y.
The strong growth numbers of June and July at 9.7% and 8.2% paved the way for the USD 895 per TEU increase in freight rates at the end of June and USD 141 per TEU at the beginning of August. Even though the September numbers are still pending, freight rates tell a story of poor demand growth.
In the meantime, on the front-haul trans-Pacific trading lanes from the Far East to the US West Coast, volumes are still below the aggregate numbers of the first eight months of 2012, by 0.4%. Following a weak first half of 2013, the y-o-y monthly growth figures for July and August came in at 1.0% and 4.2% respectively. From March to June, volume growth was negative, which placed a downward pressure on freight rates. The positive monthly y-o-y growth numbers have stabilised freight rates at around USD 1,900-2,000 per FEU.
In spite of the poor demand figures for US West Coast imports, freight rates levels have been much more stable than freight rates on the Far East to Europe trading lane during 2013. A steady decline of 17% from the start of the year compares to the very volatile spot freight rate environment of the Far East to the European “battlefield”.

Demand growth in the minor trades is still solid, and is expected to deliver 5-7% of full year volume growth. Minor trades include North-South, intra-regional and South-South trades.
Supply:
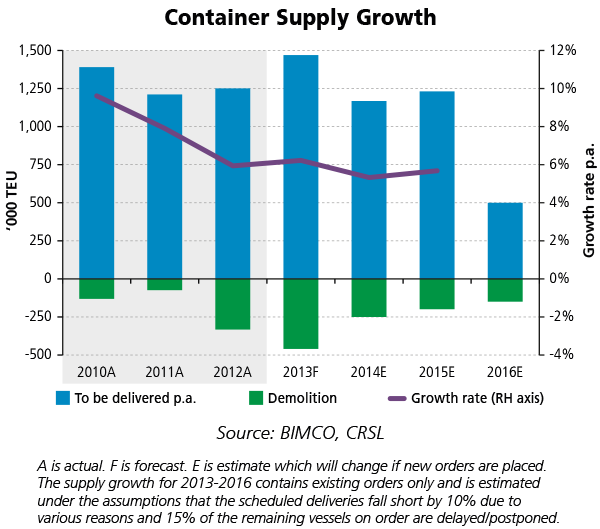
Following the seasonal Summer slowdown in the pace of new deliveries, BIMCO expects the final three months of the year to deliver an average of 110,000 TEU each of new capacity, bringing the total within reach of the all-time-high level of 1.5 million TEU back in 2008. October to December will see mostly sub-10,000 TEU ships delivered, as the next wave of 10,000+ TEU is set to take place in March and April 2014.
The total fleet has just surpassed the 17 million TEU mark, with 317,000 TEU leaving the fleet for recycling. So far this year, 175 newly build containerships of 1.16 million TEU have been launched. This brings the fleet growth to 5.1% for the year to date.
Containership contracting has been on fire in July and August, during which time the new orders placed during this year doubled to reach the current 1.52 million DWT. Two-thirds of these new orders are for 2015-delivery. This has caused the BIMCO supply growth outlook, based only on existing orders, to show an almost full order book for the shipyards two years into the future. The average annual number of delivered capacity from 2006-2012 is 1.3 million TEU.
A feature worth mentioning is that in mid-August, China’s Shanghai Waigaoqiao shipyard has landed the nation’s first 16,000 TEU vessel in a quest to enter the high-spec. and high-value shipbuilding segments. The ship will be delivered in 2016.
The drive for lowering unit cost per transported container is driving this run to yards; bigger and bigger ships meant to exploit economies of scale. Nevertheless, they will only do so on “the big chain ring” if they are utilised to their full extent. As long as overcapacity reigns, the deployment into service must happen cautiously in order to maintain the razor-sharp balance in the market. Order-book-to-fleet ratio for ULCS (+10,000 TEU) now stand at 76%.
Outlook:
As the peak season is behind us now, owners and operators will spend the coming month focusing on capacity adjustment across the board. On the Far East to Europe route, the widely announced 1 October change to freight rates were dismissed before momentum arrived; now 1 November is the next yardstick for measuring the bargaining power between the individual carriers and their customers.
By looking at the idle fleet numbers, we find little comfort that earnings will improve significantly unless several tools are applied. The idle fleet stands at 416,000 TEU, or 2.4% of the fleet – some 50% below the level at the same time last year. However, we do not need to go this high as a lot of “blank sailings” and temporarily services withdrawals are doing quite a solid job in lifting the utilisation level of the deployed fleet. During the July-August lift of freight rates, the idle fleet did not go beyond the 470,000 TEU level.
Volume growth in 2012 on the Far East to Europe route was negative, while it was flat on trans-Pacific trade. Due to the disappointing 2012 level of transported containers, we must see positive monthly growth rates in the final months of the year – anything but that would be the result of an unexpected setback in US and European consumer demand.

It remains the supply-side that has to be actively managed, even though the demand side is about to grow stronger in the coming years. We will still be in the single-digit zone of growth levels, as compared to the regular double-digit grown during most of the years in the “noughties”; slow steaming beyond what we see today, larger numbers of vessels in selected services, still a lot of recycling activity and network optimisation is what you can expect.
The strong growth numbers of June and July at 9.7% and 8.2% paved the way for the USD 895 per TEU increase in freight rates at the end of June and USD 141 per TEU at the beginning of August. Even though the September numbers are still pending, freight rates tell a story of poor demand growth.
In the meantime, on the front-haul trans-Pacific trading lanes from the Far East to the US West Coast, volumes are still below the aggregate numbers of the first eight months of 2012, by 0.4%. Following a weak first half of 2013, the y-o-y monthly growth figures for July and August came in at 1.0% and 4.2% respectively. From March to June, volume growth was negative, which placed a downward pressure on freight rates. The positive monthly y-o-y growth numbers have stabilised freight rates at around USD 1,900-2,000 per FEU.
In spite of the poor demand figures for US West Coast imports, freight rates levels have been much more stable than freight rates on the Far East to Europe trading lane during 2013. A steady decline of 17% from the start of the year compares to the very volatile spot freight rate environment of the Far East to the European “battlefield”.
Demand growth in the minor trades is still solid, and is expected to deliver 5-7% of full year volume growth. Minor trades include North-South, intra-regional and South-South trades.
Supply:
Following the seasonal Summer slowdown in the pace of new deliveries, BIMCO expects the final three months of the year to deliver an average of 110,000 TEU each of new capacity, bringing the total within reach of the all-time-high level of 1.5 million TEU back in 2008. October to December will see mostly sub-10,000 TEU ships delivered, as the next wave of 10,000+ TEU is set to take place in March and April 2014.
The total fleet has just surpassed the 17 million TEU mark, with 317,000 TEU leaving the fleet for recycling. So far this year, 175 newly build containerships of 1.16 million TEU have been launched. This brings the fleet growth to 5.1% for the year to date.
Containership contracting has been on fire in July and August, during which time the new orders placed during this year doubled to reach the current 1.52 million DWT. Two-thirds of these new orders are for 2015-delivery. This has caused the BIMCO supply growth outlook, based only on existing orders, to show an almost full order book for the shipyards two years into the future. The average annual number of delivered capacity from 2006-2012 is 1.3 million TEU.
A feature worth mentioning is that in mid-August, China’s Shanghai Waigaoqiao shipyard has landed the nation’s first 16,000 TEU vessel in a quest to enter the high-spec. and high-value shipbuilding segments. The ship will be delivered in 2016.
The drive for lowering unit cost per transported container is driving this run to yards; bigger and bigger ships meant to exploit economies of scale. Nevertheless, they will only do so on “the big chain ring” if they are utilised to their full extent. As long as overcapacity reigns, the deployment into service must happen cautiously in order to maintain the razor-sharp balance in the market. Order-book-to-fleet ratio for ULCS (+10,000 TEU) now stand at 76%.
Outlook:
As the peak season is behind us now, owners and operators will spend the coming month focusing on capacity adjustment across the board. On the Far East to Europe route, the widely announced 1 October change to freight rates were dismissed before momentum arrived; now 1 November is the next yardstick for measuring the bargaining power between the individual carriers and their customers.
By looking at the idle fleet numbers, we find little comfort that earnings will improve significantly unless several tools are applied. The idle fleet stands at 416,000 TEU, or 2.4% of the fleet – some 50% below the level at the same time last year. However, we do not need to go this high as a lot of “blank sailings” and temporarily services withdrawals are doing quite a solid job in lifting the utilisation level of the deployed fleet. During the July-August lift of freight rates, the idle fleet did not go beyond the 470,000 TEU level.
Volume growth in 2012 on the Far East to Europe route was negative, while it was flat on trans-Pacific trade. Due to the disappointing 2012 level of transported containers, we must see positive monthly growth rates in the final months of the year – anything but that would be the result of an unexpected setback in US and European consumer demand.
It remains the supply-side that has to be actively managed, even though the demand side is about to grow stronger in the coming years. We will still be in the single-digit zone of growth levels, as compared to the regular double-digit grown during most of the years in the “noughties”; slow steaming beyond what we see today, larger numbers of vessels in selected services, still a lot of recycling activity and network optimisation is what you can expect.