


How fast will ship demand grow? It's the ultimate question for serious shipping investors. Today’s global economy relies on owners stepping up to invest in the ships that will be needed in the future ($115 billion was invested in new contracts last year). With so much cash on the table, the future trade growth issue cannot be ignored. But it's tricky and even experienced analysts fall back on “rules of thumb”.
Faster Than World GDP
When they worry about the future most shipping investors have the world economy at the back of their minds. But although world GDP is the obvious starting point for analysing sea transport, the relationship between the world economy and seaborne trade growth needs handling with care. Unfortunately things do not always turn out the way investors expect.
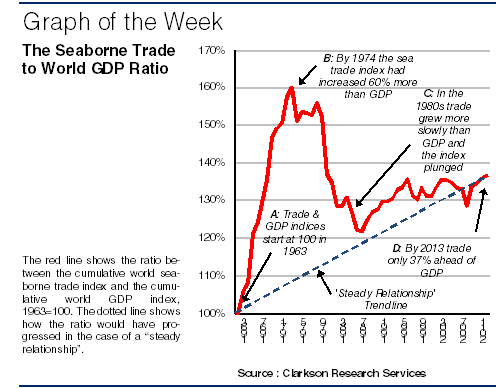
For example, over the 50 years since 1963 these two key ship demand variables have increased by a not too dissimilar amount. GDP grew on average at 3.7% p.a. and sea trade grew at 4.5% pa. Overall trade volume increased 722% and GDP by 501%. If the relationship had been steady, the ratio of trade to GDP would have followed the path shown by the dotted line on the graph, moving steadily up from 100% in 1963 to 137% in 2013 (i.e. the sea trade index 37% higher than the GDP index, both of which were 100 in 1963). Interestingly today’s GDP forecasts are close to the 50 year trend, with projected growth of 3.6% in 2014 and 3.9% in 2015. So does that mean about 4.5% trade growth?
Sea Trade Multiplier?
That’s not always how things happen. The red line shows that the “sea trade multiplier”, which compares the cumulative year by year growth in the sea trade and GDP indices since 1963, was all over the shop. In the 1960s trade shot ahead of GDP and the multiplier reached 160% in 1974. Then the relationship reversed and in the period 1980-88 sea trade growth averaged only 0.4% pa compared with 3.2% pa for GDP. Again in 2005-09 trade lost ground as GDP growth averaged 3.5% pa and trade only 2.4%.
Structural Changes
This analysis suggests that when looking ahead more than a year or two, the structural changes that lie ahead are more interesting than the trend. The 1960s boom was driven by the OECD countries adjusting to global free trade by importing massive quantities of bulk commodities like iron ore and oil. Then the trade collapse in the 1980s was a structural response to high oil prices. And the trade slowdown in the late 2000s shows that the slowing OECD economies (less growth and more services) were important enough to shave the top off the Chinese mega-boom.
Brave New World
So, demand trends are all very well, but structural changes may matter more. Today high energy prices are squeezing the oil trade and the non-OECD world, which is increasingly important, seems to be moving into a different phase of growth. Although the 4.5% trade growth “multiplier” scenario looks convincing, remember that it is during structural changes that shipping fortunes are often made and lost. Have a nice day.
Faster Than World GDP
When they worry about the future most shipping investors have the world economy at the back of their minds. But although world GDP is the obvious starting point for analysing sea transport, the relationship between the world economy and seaborne trade growth needs handling with care. Unfortunately things do not always turn out the way investors expect.
For example, over the 50 years since 1963 these two key ship demand variables have increased by a not too dissimilar amount. GDP grew on average at 3.7% p.a. and sea trade grew at 4.5% pa. Overall trade volume increased 722% and GDP by 501%. If the relationship had been steady, the ratio of trade to GDP would have followed the path shown by the dotted line on the graph, moving steadily up from 100% in 1963 to 137% in 2013 (i.e. the sea trade index 37% higher than the GDP index, both of which were 100 in 1963). Interestingly today’s GDP forecasts are close to the 50 year trend, with projected growth of 3.6% in 2014 and 3.9% in 2015. So does that mean about 4.5% trade growth?
Sea Trade Multiplier?
That’s not always how things happen. The red line shows that the “sea trade multiplier”, which compares the cumulative year by year growth in the sea trade and GDP indices since 1963, was all over the shop. In the 1960s trade shot ahead of GDP and the multiplier reached 160% in 1974. Then the relationship reversed and in the period 1980-88 sea trade growth averaged only 0.4% pa compared with 3.2% pa for GDP. Again in 2005-09 trade lost ground as GDP growth averaged 3.5% pa and trade only 2.4%.
Structural Changes
This analysis suggests that when looking ahead more than a year or two, the structural changes that lie ahead are more interesting than the trend. The 1960s boom was driven by the OECD countries adjusting to global free trade by importing massive quantities of bulk commodities like iron ore and oil. Then the trade collapse in the 1980s was a structural response to high oil prices. And the trade slowdown in the late 2000s shows that the slowing OECD economies (less growth and more services) were important enough to shave the top off the Chinese mega-boom.
Brave New World
So, demand trends are all very well, but structural changes may matter more. Today high energy prices are squeezing the oil trade and the non-OECD world, which is increasingly important, seems to be moving into a different phase of growth. Although the 4.5% trade growth “multiplier” scenario looks convincing, remember that it is during structural changes that shipping fortunes are often made and lost. Have a nice day.