
Safe Approach Speed:
When we talk about the safe approach speed of a vessel, we refer to the linear speed of the ship as it approaches a port facility, which should be systematically reduced in a safe manner, step by step, and the management of the horizontal approach speed as the vessel docks, depending on its displacement and mass.
The largest maritime accidents recorded in maritime history have generally occurred due to poor management of this approach speed.
Although calculations derived from variables such as the ship's mass, engine characteristics, the power of the tugs used, the angle of approach, and natural conditions can be formulated, we will address the topic more from the perspective of practical use based on experience.
However, before delving into the practical aspects of the subject, let’s present the formula for calculating the approach speed and the distance covered:
W = Ship's displacement + Added mass (ton)
F = Decelerating force applied by the tug or ship engine (ton)
As shown in the diagram below, this formula allows us to determine the decelerating force that should be applied to the ship at the second point based on the desired speed, as well as the distance to be covered during this time.
While this may be very useful for understanding the topic, it is not realistic to expect ship users to perform such calculations before maneuvers.
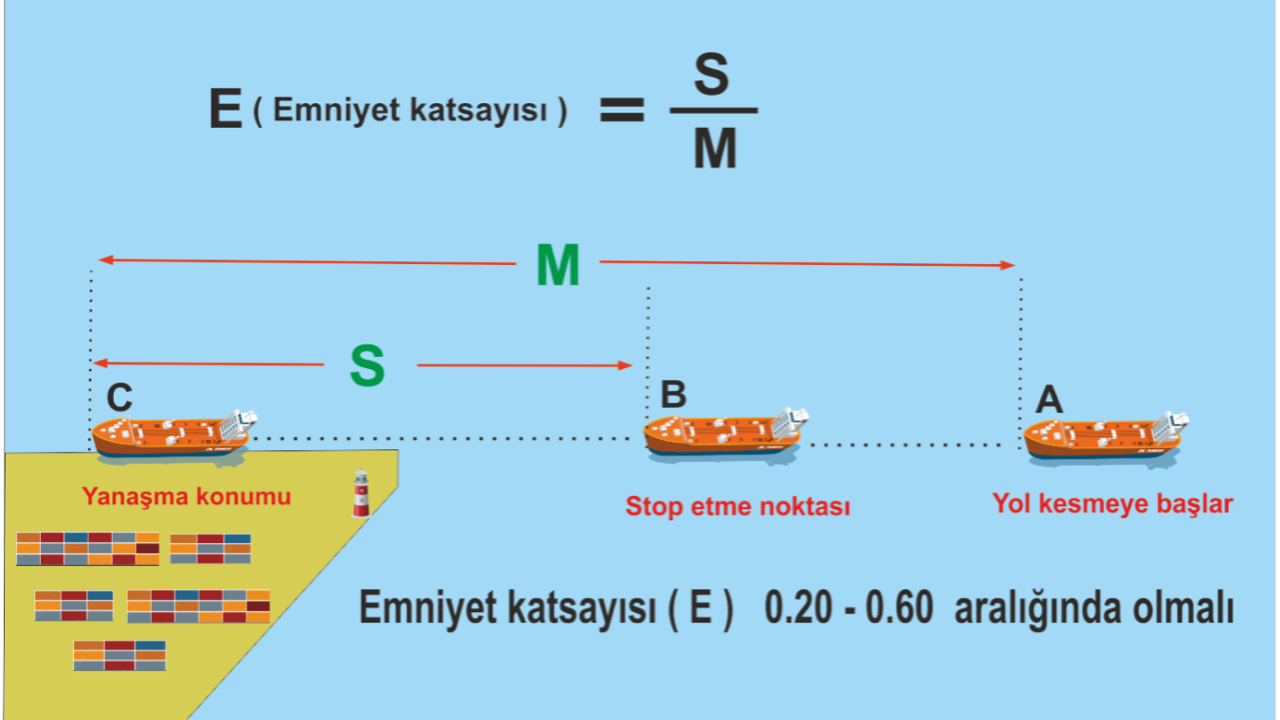
In this regard, safety criteria have largely been determined by experience based on ship types, how loaded they are, and existing natural conditions. A safety criterion that is easy to remember can be explained through the diagram below:
When the ship in the above diagram reaches point A, it has begun to cut speed. Point B is where it has stopped its engines. The distance (S) from this position to the point where the ship will dock, divided by the distance (M) from the initial position where it started cutting speed to the final docking point, yields a safety coefficient expressed as (E).
It is expected that the safety coefficient will range between 0.20 and 0.60, depending on the total effect of the ship's displacement and added weight. Although it is stated that the safety coefficient should be within these specified values, it is beneficial to consider the displacements of the ships and elaborate on this coefficient value a bit more.
For large displacement vessels, a ratio closer to 0.20 is ideal in the safety coefficient calculation. As displacement decreases, a higher safety coefficient closer to 0.60 is observed.
To illustrate what we have explained, let’s refer to the diagram below:
In the diagram above, a container ship, nearly 300 meters long, begins to cut speed 2.5 miles away from its docking position and stops its engines 0.7 miles from the same point. With these values, the safety coefficient is calculated as 0.28.
On the other hand, a 125-meter long container ship approaching another berth at the same terminal starts cutting speed 1.2 miles away from the dock and stops its engines 0.6 miles from that position. With these values, the safety coefficient is calculated as 0.50.
As can be seen, if the larger vessel attempts to cut speed at a distance corresponding to a safety coefficient of 0.50, it will likely have a relatively high speed outside the safety criteria during the approach to the dock.
In conclusion, it can be expected that smaller displacement vessels will be closer to the upper values of this safety coefficient range. However, larger displacement vessels should have lower values for their safety coefficients.
As mentioned at the beginning, our article will emphasize experiences and repeatedly tested criteria rather than theoretical calculations. Thanks to the experiences of ship captains and pilot captains over the years, we have a broad pool of information. This knowledge pool, which includes our own experiences, has been categorized according to specific ship types and tonnages for practical use. The deadweight tonnages corresponding to example ships and their lengths belong to certain vessels still in service, but their names have not been provided in the table.
When creating the table below, it is assumed that the ships are fully loaded, and the required speeds are given based on the distance remaining to the target. However, it should be noted that ships with very similar tonnages and lengths may have significantly different underwater shapes, engine powers, and capacities. Therefore, it is more accurate to view and evaluate the values given in the table as a rough reference. Depending on these different characteristics, these values may vary, and the best evaluations will be made by ship captains who know their vessels better than anyone else and who can benefit from the advice of the pilot captain operating in the area. Another point to remind is that the effects of currents and winds, among other natural conditions within normal limits, have been taken into account while preparing this table.
It would be appropriate to revise these values as necessary under considerable current and wind effects.
When examining the table, it will be noted that it is recommended for cargo ships to enter the approach maneuver at a lower speed compared to container ships of similar tonnage and length.
This is because container ships of similar tonnage are generally equipped with bow and stern thrusters, allowing them to compensate for a lack of steering control without having to give way again. However, many cargo ships lack this capability, so a relatively lower approach speed is recommended to allow for brief forward thrusts to regain steering control. The same situation can be observed when comparing bulk carriers, tankers, and container ships of similar sizes. Bulk carriers and tankers of similar sizes approach at lower and more controlled speeds compared to their container ship counterparts.
Many factors, such as the ship's displacement, underwater structure, wind area, hull slenderness ratio, engine power and characteristics, steering system, and whether it has bow or stern thrusters, as well as trim conditions, directly affect the speed control methods during terminal approaches under normal conditions. Essentially, these characteristics present different scenarios even for ships within the same tonnage range. The person who knows these characteristics best is none other than the ship captain themselves. Although pilot captains are quite experienced in these matters, it is extremely important for the ship captain to explain these characteristics to the pilot captain for the safety of port maneuvers.
The table provided above has also been organized with the multi-curve graph below for practical use.
No matter how safe the approach method may be, it should not be forgotten that machinery, steering systems, and, if available, bow and stern thrusters can always malfunction. Ideally, tugs should be safely attached to the vessel at least 0.5 miles before the dock. The hydrodynamic interactions between the tug and the vessel can sometimes create low and high-pressure areas near the bow and stern of the ship, and at high speeds, this can lead to dangerous situations such as the tug losing control and colliding with the vessel. Therefore, it is considered safe for tugs to perform line handling operations when the vessel's speed is between 3 and 3.5 knots.
Unless there is an emergency, tugs should not enter the docking position when the vessel's speed is 4 knots or higher. As mentioned above, the recommended approach speeds in the table and graph are based on fully loaded ship conditions under normal natural conditions. However, some docks may be subject to very strong currents and winds due to weather conditions and surrounding natural and meteorological factors. In such cases, the ship user may prefer to approach the dock at a speed above the recommended limit. The tugs used during the vessel's maneuver may not be fully sufficient under extreme current and wind conditions.
The effect of currents and winds on a vessel is inversely proportional to the change in its own speed. For example, a vessel approaching the dock at a speed of 1.5 knots five (5) ship lengths away in a strong current will experience half the effect of the wind on the vessel when its speed is increased to 3 knots. The same applies to currents.
In such a situation, the ship user may resort to a different method, in addition to the assistance of tugs, by adjusting the vessel's speed as needed and taking precautions in advance. To explain this through the diagram below:
In the diagram, a container ship over 200 meters long is entering the approach maneuver in a strong current of around 2-3 knots.
Since its draft is over 10 meters, the effect of the current on it will geometrically increase as the water depth beneath the keel decreases. At this point, even if the tug can control the stern, the bow thruster will likely not be sufficient, and while trying to control the stern against the current, the vessel will inevitably tend to turn disproportionately towards the quay. However, the ship user employs a different method here. To be less affected by the current, they increase the vessel's speed and position the ASD tug they have tied at the stern towards the center. When the ship enters the alignment of the facility on the starboard side, the effect of the current will already be minimized. As soon as this point is passed, they appropriately operate the engine in reverse to reduce the approach speed, which is slightly above normal. However, if they want to decrease the speed more quickly according to the situation, they can use the tug positioned at the stern to reduce the vessel's speed as desired without delay.
Lateral Safe Approach Speed: The lateral approach speeds of vessels while docking at quays and terminals are also very important. This becomes even more critical as the displacements of the vessels increase.
At tanker terminals, there are electronic speed indicators visible from a distance that show the lateral approach speed of the vessel separately for the bow and stern to assist the ship user.
Especially for relatively large vessels, it is a frequently applied method to align parallel to the dock as they approach and dock at a controlled speed.
Attempting to make contact with the dock along the length of the vessel as uniformly as possible through a parallel approach, rather than at a single point, is a much safer and recommended method.
A high lateral approach speed can cause initial or unnoticed damage to the fendering systems, as well as displacing the piles on which the dock rests.
Similar to the longitudinal approach speed, there is also a safety coefficient calculated for the lateral approach speed.
In the diagram above, a vessel is shown performing a docking maneuver with the assistance of two tugs tied at the bow and stern against a strong headwind. The distance (M) indicates the distance from the point where the tugs began pulling the vessel against the wind to the dock. The distance (S) shows the distance to the dock from the point where the vessel's lateral movement stops. It is recommended that the safety coefficient obtained by dividing the value of S by the value of M be between 0.20 and 0.60, depending on the vessel's tonnage.
As the vessel's tonnage increases, it is expected that the safety coefficient will approach the value of 0.20. The further away the stopping operation of the vessel begins from the dock, the smaller the coefficient will be.
The first research in this area was conducted by Prof. A. L. L. Baker in 1953, who recorded some dockings in UK ports and the Arabian Peninsula. This research was later developed by researchers Saulin and Brolsman, resulting in charts known as Brolsman Curves.
Brolsman also added records obtained from some Scottish ports and Rotterdam to existing studies. The Brolsman Curves were detailed at a congress convened to provide technical advice to the industry and presented as decisions of PIANC 2002 (Permanent International Association of Navigation Congresses).
In addition to these studies, the EAU 2012 conducted by German authorities and the Spanish ROM 0.2 - 90 studies carried out by Spanish authorities are also used in the industry.
The recommended values in these studies are summarized in the graph below based on the deadweight ton values of the vessels:
In the graph above, the three curves shown with dotted lines represent the ideal, normal, and unacceptable values according to the EAU 2012 criteria based on the vessel's dwt value.
Upon examining the graph, it will be seen that after 70,000 dwt, these values remain quite close to each other.
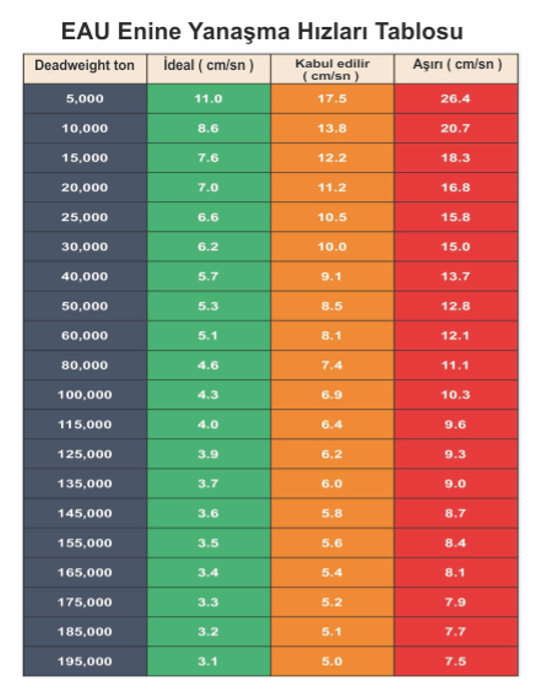
The data presented by these three curves have also been provided in table format above for convenience. The speed value is given in cm/s.
Please pay attention to the comment writing rules below when commenting or responding to a comment. Do not make comments that violate the laws of the Republic of Turkey, or that glorify crime or criminals. Do not use profanity, slang, insults, hate speech, or incite hatred.
Photo: DenizHaber
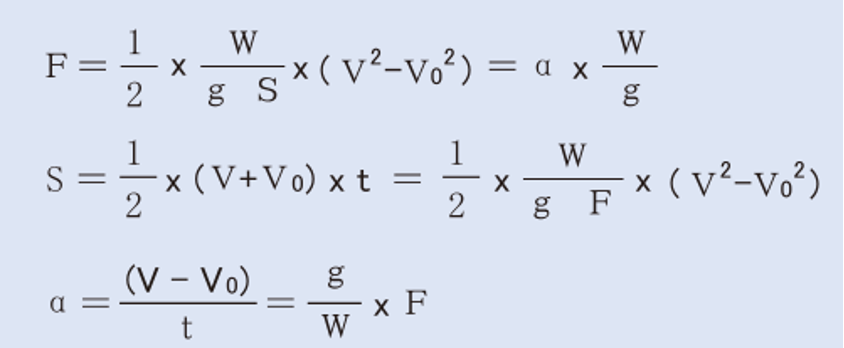
Photo: DenizHaber

Photo: DenizHaber
Photo: DenizHaber

Photo: DenizHaber
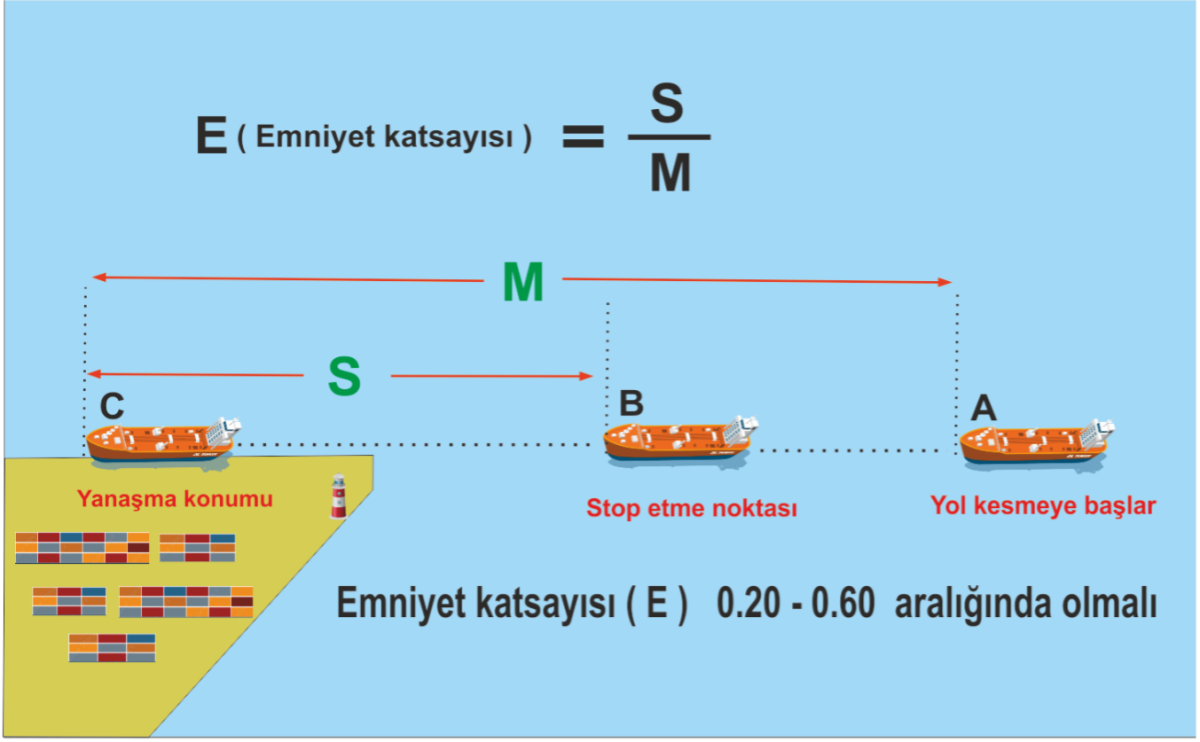
Photo: DenizHaber
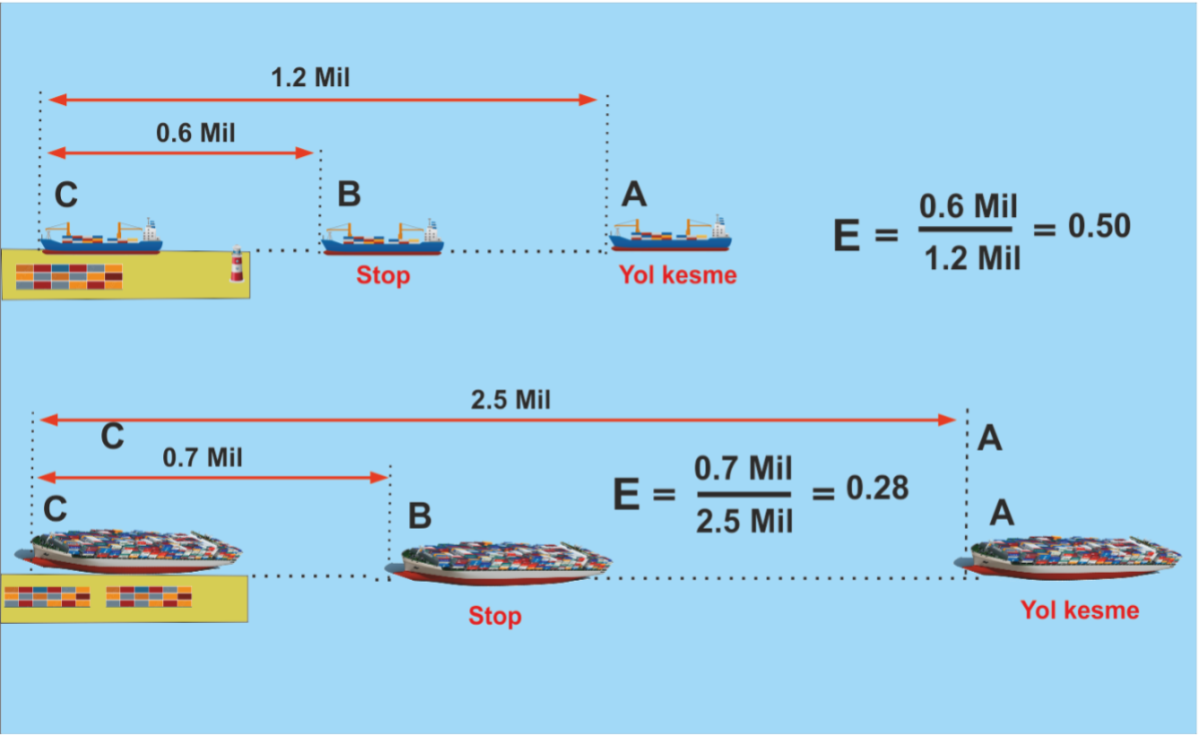
Photo: DenizHaber
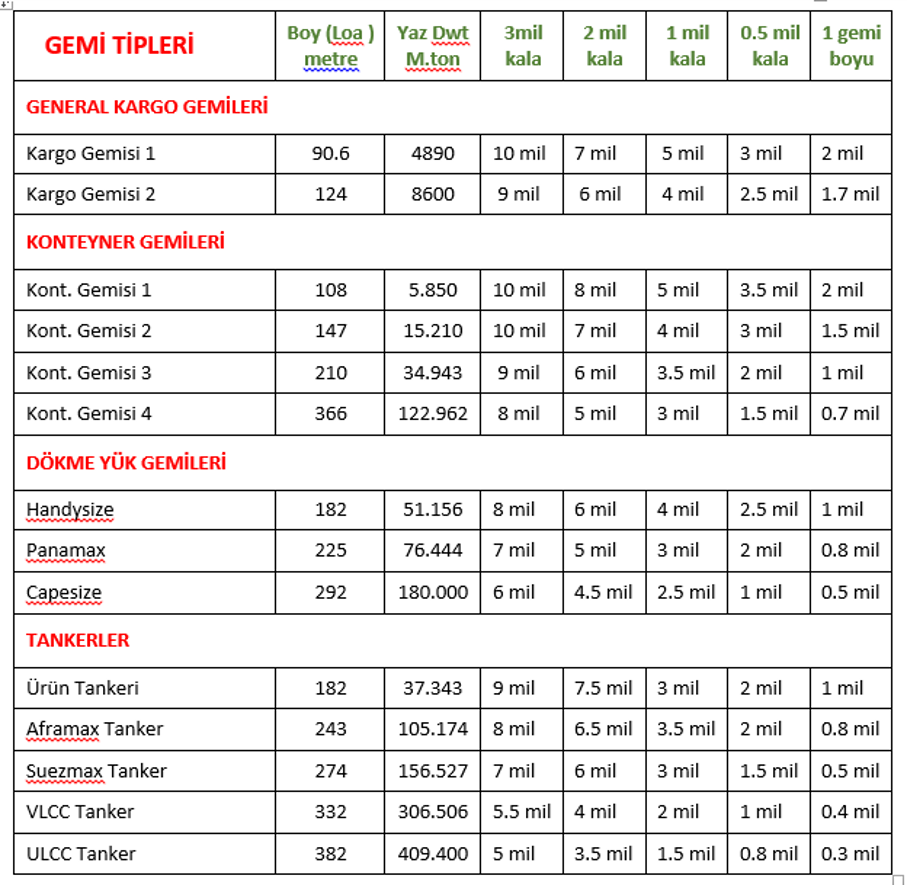
Photo: DenizHaber
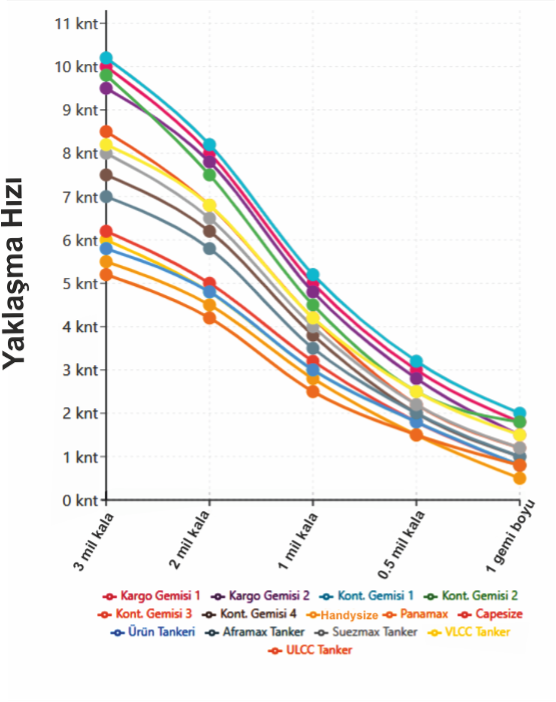
Photo: DenizHaber
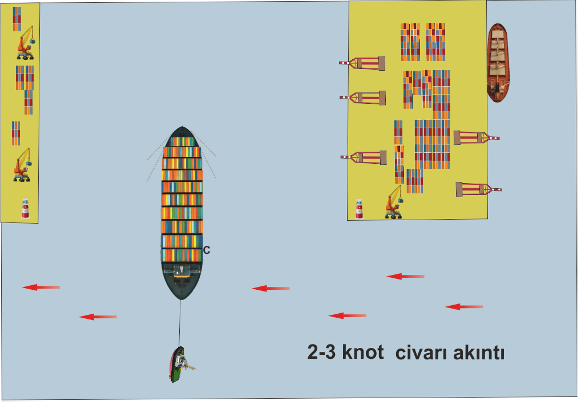
Photo: DenizHaber
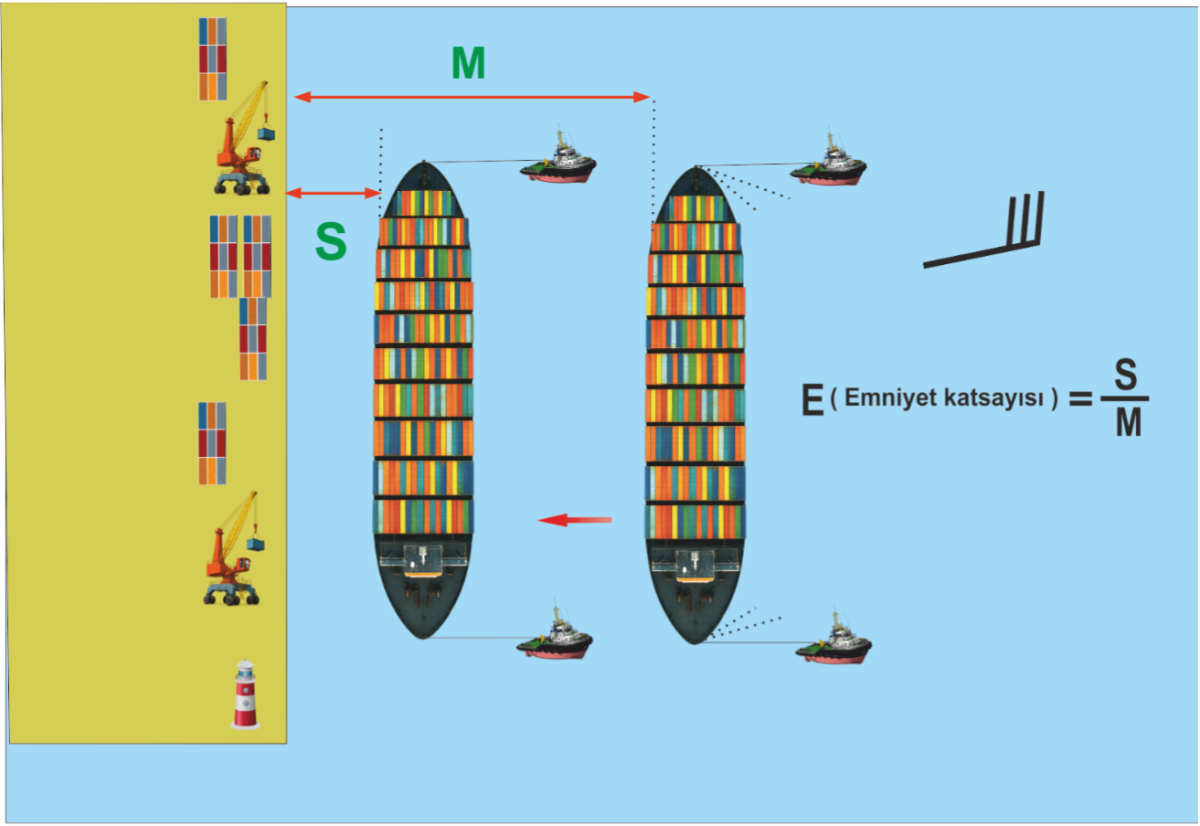
Photo: DenizHaber
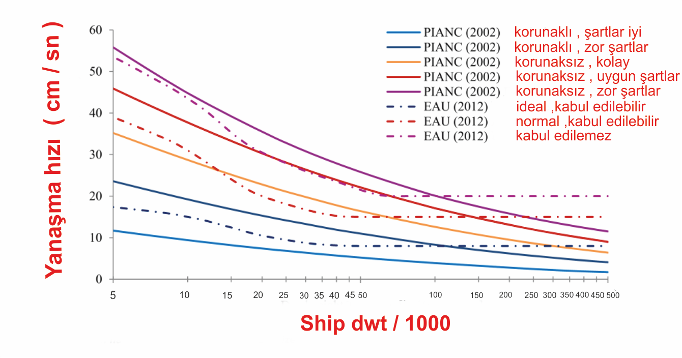
Photo: DenizHaber

Photo: DenizHaber
Source: www.denizhaber.com