
The annual Clarksea Index forecasting competition involves readers sending their forecast of the Clarksea Index for the first week of November next year.
The following November we see who was closest, and also work out the average of the entries which gives a pretty good idea of market expectations.
What Happened – Not Very Nice Bluntly, this has been the worst year since 1990 when CRSL started compiling the earnings indices which contribute to the Clarksea Index.
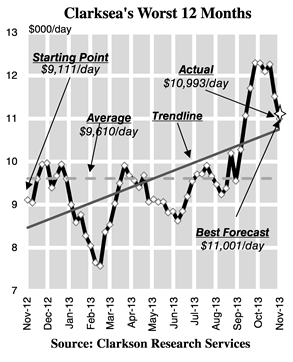 Over the 12 months, weekly earnings averaged $9,610/day; lower than the 2001/02 average of $9,780/day, and dipping below $10,000/day for the first time since then. Of course, the Index moved around a bit (see chart), with a nasty dip in the spring of 2013 when the Index fell to $7,574/day, a plateau over the summer when the Index fluctuated in the $9-10,000/day band, then a recovery in the autumn.
But the recovery did not make up for the weak spring, and the average remained doggedly below $10,000/day.What the Forecasters SaidOf course the whole point of the exercise is to see what our readers expected.
The target date for last year’s entrants was 1 November 2013 and on that date the actual value of the Clarksea Index was $10,993 a day, up 20% on the actual value of $9,111/day on 2 November 2012 when the forecasts were made. If the predictions made by entrants are a guide, this still rather gloomy outcome will not have surprised anyone. The average of the forecasts was $10,843/day. An astonishingly accurate average prediction, possibly the most accurate ever.
The spread was also narrow, with a standard deviation of only $2,128/day. A handful of optimists saw rates edging up to $15-16,000/day, while two deep pessimists clocked in at $7,500/day, a number which did actually crop up for a few weeks in February. But the vast majority of predictions were in the $8-10,000/day band. So the market did not have great expectations.It Wasn’t Always AwfulJust as a reminder of how good it can be, when we ran the competition in 2004, the average Index over the twelve months was $29,965/day and the actual value on the target date was $29,554/day. That means that shipping investors earned 3.1 times as much cash in 2004/5 for doing precisely the same thing.
A reminder that shipping is a feast and famine business. But the predictions ranged from $10,000/day to $50,000/day, so there was greater uncertainty about whether the good times would last.Where Now, Where Next?So there you have it. A miserable year, but one entrant produced a super accurate forecast of $11,001/day. Just $8 away from the actual outcome. Congratulations to Colin Davis of Houlihan Lokey, the 2013 winner. Your champagne is on its way. But in shipping, each year brings a new market. Investors seem to sense recovery, but what do you think? Why not let us know?
The following November we see who was closest, and also work out the average of the entries which gives a pretty good idea of market expectations.
What Happened – Not Very Nice Bluntly, this has been the worst year since 1990 when CRSL started compiling the earnings indices which contribute to the Clarksea Index.
Over the 12 months, weekly earnings averaged $9,610/day; lower than the 2001/02 average of $9,780/day, and dipping below $10,000/day for the first time since then. Of course, the Index moved around a bit (see chart), with a nasty dip in the spring of 2013 when the Index fell to $7,574/day, a plateau over the summer when the Index fluctuated in the $9-10,000/day band, then a recovery in the autumn. But the recovery did not make up for the weak spring, and the average remained doggedly below $10,000/day.What the Forecasters SaidOf course the whole point of the exercise is to see what our readers expected.
The target date for last year’s entrants was 1 November 2013 and on that date the actual value of the Clarksea Index was $10,993 a day, up 20% on the actual value of $9,111/day on 2 November 2012 when the forecasts were made. If the predictions made by entrants are a guide, this still rather gloomy outcome will not have surprised anyone. The average of the forecasts was $10,843/day. An astonishingly accurate average prediction, possibly the most accurate ever.
The spread was also narrow, with a standard deviation of only $2,128/day. A handful of optimists saw rates edging up to $15-16,000/day, while two deep pessimists clocked in at $7,500/day, a number which did actually crop up for a few weeks in February. But the vast majority of predictions were in the $8-10,000/day band. So the market did not have great expectations.It Wasn’t Always AwfulJust as a reminder of how good it can be, when we ran the competition in 2004, the average Index over the twelve months was $29,965/day and the actual value on the target date was $29,554/day. That means that shipping investors earned 3.1 times as much cash in 2004/5 for doing precisely the same thing.
A reminder that shipping is a feast and famine business. But the predictions ranged from $10,000/day to $50,000/day, so there was greater uncertainty about whether the good times would last.Where Now, Where Next?So there you have it. A miserable year, but one entrant produced a super accurate forecast of $11,001/day. Just $8 away from the actual outcome. Congratulations to Colin Davis of Houlihan Lokey, the 2013 winner. Your champagne is on its way. But in shipping, each year brings a new market. Investors seem to sense recovery, but what do you think? Why not let us know?