
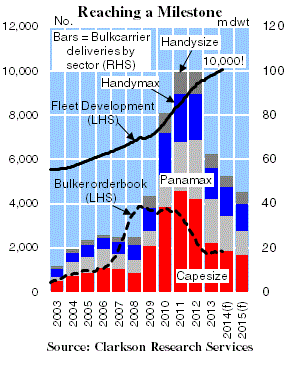
During January 2014, the number of vessels in the bulkcarrier fleet (above 10,000 dwt) reached 10,000.
This has been a result of remarkable growth in the fleet, with particularly unprecedented expansion in the last few years.
 Pacing Out Fleet Growth
It took approximately nineteen years for the number of vessels in the bulkcarrier fleet to double from 5,000 to 10,000 vessels. During the first fifteen years of this period, the fleet grew from 5,000 vessels to 7,500.
While, as shown by the Graph of the Month, the expansion of the fleet from 7,500 vessels to 10,000 vessels (33% growth) was much more rapid and took just less than four years. During the same time period, the volume of tonnage in the bulkcarrier fleet grew 55%.
The increase in tonnage has outpaced growth in terms of number of vessels as a result of a firm increase in Capesize capacity and continued upsizing trends.
The Role of Deliveries
Fleet growth significantly sped up from 2010 as deliveries into the fleet surged. The volume of tonnage delivered between 2010 and 2012 was three times that in the preceding three year period, and deliveries peaked at 99.6m dwt in 2012.
Bulker fleet capacity growth reached a peak in 2011 when the fleet expanded 17% y-o-y from 459.6m dwt to 537.9m dwt. This was followed by a further 15% growth in 2012 and 11% in 2013.
Significant volumes of deliveries were a product of increased contracting during the ordering boom in 2007 and 2008, encouraged by high earnings levels and easily available finance. The effect of firm contracting in this period was demonstrated by the rapid rise in the size of the orderbook to a peak of 3,881 vessels (325.1m dwt, equivalent to 78% of the fleet) in November 2008.
As the vessels contracted in the ordering boom started to be delivered into the fleet from 2009 onwards, the size of the orderbook began to fall. However, an uptick in contracting in 2010 delayed the onset of a rapid decline until 2011, when new ordering slowed again.
Watching the Orderbook
From 2011 to mid-2013, the size of the bulkcarrier orderbook shrank, and despite a slight expansion in recent months, the orderbook is now at a much more manageable size.
At the start of March 2014, the orderbook numbered 1,848 vessels of a combined 153.5m dwt (equivalent to 21% of the fleet). With fewer bulkcarriers on order, it is expected that deliveries into the fleet will continue to slow in the short-term.
Approximately 62.4m dwt was delivered into the fleet in full year 2013. It is projected that bulkcarrier deliveries will decline by 16% y-o-y in 2014 to 52.6m dwt, and by a further 13% y-o-y in 2015.So, after accounting for a projected slowdown in deliveries and upcoming demolition trends, bulker fleet growth is expected to slow in the short-term.
After average growth of 5.2% p.a. over the last 40 years, fleet growth is currently expected to reach 4.6% in 2014 and 3.6% in 2015.
This has been a result of remarkable growth in the fleet, with particularly unprecedented expansion in the last few years.
Pacing Out Fleet GrowthIt took approximately nineteen years for the number of vessels in the bulkcarrier fleet to double from 5,000 to 10,000 vessels. During the first fifteen years of this period, the fleet grew from 5,000 vessels to 7,500.
While, as shown by the Graph of the Month, the expansion of the fleet from 7,500 vessels to 10,000 vessels (33% growth) was much more rapid and took just less than four years. During the same time period, the volume of tonnage in the bulkcarrier fleet grew 55%.
The increase in tonnage has outpaced growth in terms of number of vessels as a result of a firm increase in Capesize capacity and continued upsizing trends.
The Role of Deliveries
Fleet growth significantly sped up from 2010 as deliveries into the fleet surged. The volume of tonnage delivered between 2010 and 2012 was three times that in the preceding three year period, and deliveries peaked at 99.6m dwt in 2012.
Bulker fleet capacity growth reached a peak in 2011 when the fleet expanded 17% y-o-y from 459.6m dwt to 537.9m dwt. This was followed by a further 15% growth in 2012 and 11% in 2013.
Significant volumes of deliveries were a product of increased contracting during the ordering boom in 2007 and 2008, encouraged by high earnings levels and easily available finance. The effect of firm contracting in this period was demonstrated by the rapid rise in the size of the orderbook to a peak of 3,881 vessels (325.1m dwt, equivalent to 78% of the fleet) in November 2008.
As the vessels contracted in the ordering boom started to be delivered into the fleet from 2009 onwards, the size of the orderbook began to fall. However, an uptick in contracting in 2010 delayed the onset of a rapid decline until 2011, when new ordering slowed again.
Watching the Orderbook
From 2011 to mid-2013, the size of the bulkcarrier orderbook shrank, and despite a slight expansion in recent months, the orderbook is now at a much more manageable size.
At the start of March 2014, the orderbook numbered 1,848 vessels of a combined 153.5m dwt (equivalent to 21% of the fleet). With fewer bulkcarriers on order, it is expected that deliveries into the fleet will continue to slow in the short-term.
Approximately 62.4m dwt was delivered into the fleet in full year 2013. It is projected that bulkcarrier deliveries will decline by 16% y-o-y in 2014 to 52.6m dwt, and by a further 13% y-o-y in 2015.So, after accounting for a projected slowdown in deliveries and upcoming demolition trends, bulker fleet growth is expected to slow in the short-term.
After average growth of 5.2% p.a. over the last 40 years, fleet growth is currently expected to reach 4.6% in 2014 and 3.6% in 2015.